Marriage and Women's Independence

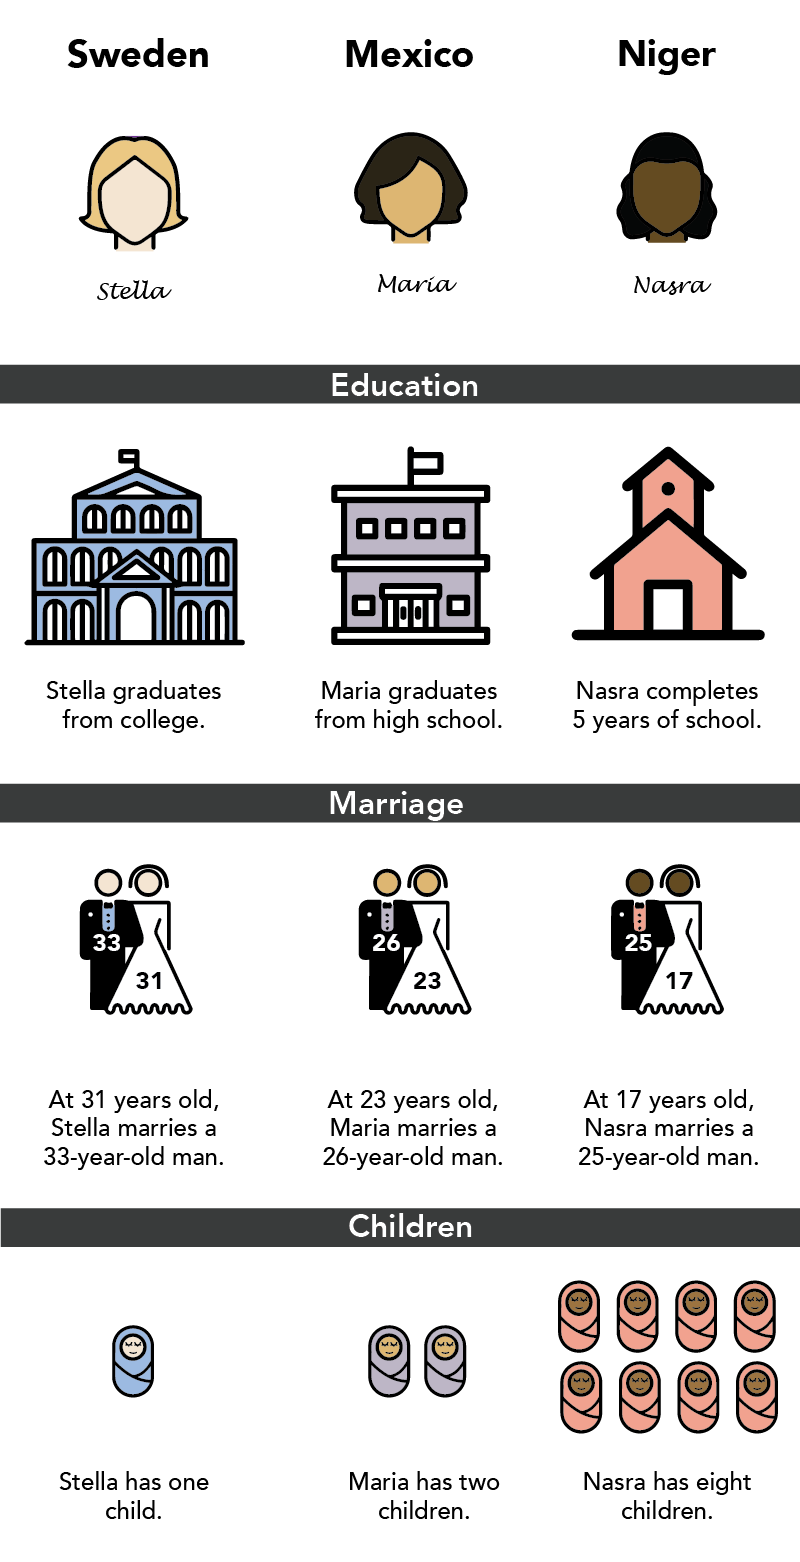
Women of different cultures are expected to get married at different points in their lives. In some countries, it is understood that a woman should wait until she is established in the world independently, with life experience all her own. In others, women get married soon after they move out of their parents home as young adults, facing the world with a partner from the start. National statistics paint different life stories of young women around the world.

In the following statistical narrative, we will be using the term independence to indicate the level of agency, or control, a woman has over her own life.

Stories

Three completely average women grow into adults in three very different countries, each facing different realities and societal structures as they shape their lives.

These three countries and cultures expect different lives from women, but how does the rest of the world compare?

Marriage around the world

Size indicates population. Mouse over country for details

Women’s age of marriage varies around the world, but how does this compare to men? Select countries from the drop down menus below to compare the likelihood of ever being married at a given age.

Sweden

Niger

Some bars missing due to incomplete data.

Freedom from Childbearing

Marriage historically and culturally is a structure for bearing and raising children. Children, babies, and pregnancy all limit women’s independence and freedom. In some countries, the average woman has many children, as we saw with Nasra. It could be that there is no access to effective contraception, that these babies are happy accidents. Child mortality rates tell another story, where families may be large to protect from all too common early deaths.

Size indicates population. Mouse over points to view details.

Learning and Labor

Education is often considered to be a proxy for a woman’s independence — the hope being that more education leads to greater career opportunities, and stronger careers lead to financial independence and stability.

On the left, school expectancy, or the number of years a child is expected to stay in school, is plotted for both men and women. Men and women spend an equal number of years in school if their country lies on the diagonal line. The box plot, on the right, shows the range of labor participation rates for men and women around the world. The central line across the bar represents to median labor force rate. Points above or below the box have labor rates in the top or bottom quartile

Size indicates population. Mouse over a point for details.

What is noticeable here is the connection between men and women’s school expectancy. When men are not expected to receive much schooling, women receive even less. Yet higher on the chart, where men’s schooling reaches approximately 12 years on average, the gender gap mostly disappears. This suggests that in countries where resources are limited, investments in education favor male children. In these countries women tend to marry earlier as well.

In considering labor participation rates, the average rates for women are (predictably) lower than those for men; the range of women’s labor rates is also larger in women than for men across different nations. It is notable that the nations with higher-than-average female marriage ages tend to converge near mean labor participation rates, across both genders.

Factors of Independence Combined

The radar chart below allows you to compare the five indicators of a woman’s independence at one time. Each indicator is standardized, so a large shape indicates a country with more independent women and small shape indicates a country where women’s lives are more restricted on average.

Select two countries from the drop down menus to compare their overall profile


Sweden vs Niger

Cultural differences are intricate and numerous, and we have certainly not considered all factors that might affect this limited definition of independence . Divorce rates, LGBTQ freedoms, and wage gaps, for instance, are just a small set of additional considerations. We hope, however, that these select few factors begin to paint a picture of contextualized female independence around the world.

Data for the most recent year available is used for each country. Data sourced from the UN (data.un.org), for age, labor force participation, education and fertility rate(births per woman), school expectancy, contraceptive use and child mortality. Created in Spring 2017 for Info 247: Information Visualization and Presentation at the UC Berkeley.